
✨ 1 Week - 빅데이터 with 파이썬
안녕하세요. 소시지입니다.
본 포스팅은 <2025.06.23 ~ 2025.06.24> 빅데이터 with 파이썬 실습 내용을 기록했습니다.
🗓️ 학습 주제
- Numpy
- Matplotlib
- Pandas
- 머신러닝 실습
Numpy
Numpy란
- 다차원 배열을 효율적으로 처리하고 쉽게 사용할 수 있도록하는 파이썬 라이브러리이다.
- 파이썬의 List에 비해 빠르고, 메모리를 효율적으로 사용한다.
- 파이썬의 List에 비해 빠르고, 메모리를 효율적으로 사용한다.
ndarray 객체
- Numpy의 핵심은 ndarray객체이며, ndarray객체는 넘파이에서 다차원 배열을 나타낸다.
- 모든 원소가 같은 자료형이어야 한다. - 한 번 생성된 배열은 원소의 개수를 변경할 수 없다
- 모든 원소가 같은 자료형이어야 한다. - 한 번 생성된 배열은 원소의 개수를 변경할 수 없다
실습 코드
2-D Array 생성
import numpy as np
arr = np.array([[1,2,3], [4,5,6]])
print(arr)
print(type(arr))
ndarray 객체
import numpy as np
arr = np.array([[1, 2, 3], [4, 5, 6]])
def print_att(arr):
    print("shape : ", arr.shape)
    print("ndim : ", arr.ndim)
    print("size : ", arr.size)
    print("dtype : ", arr.dtype)
    print("itemsize : ", arr.itemsize)
print_att(arr)
배열의 축(Axis)
import numpy as np
x = np.array([1, 2, 3, 4, 5])
y = np.array([[1, 2, 3, 4, 5]])
z = np.array([[1], [2], [3], [4], [5]])
print(x.shape, y.shape, z.shape)
linspace() 함수
import numpy as np
x = np.linspace(0, 10, 5)
y = np.linspace(0, 1, 5)
print(x)
print(y)
ones() 함수
import numpy as np
x = np.zeros(5)
y = np.zeros((2, 4))
print(x, x.shape)
print(y, y.shape)
ones_like(), zeros_like() 함수
import numpy as np
x = np.array([[1, 2], [3, 4]])
print(x.shape)
y = np.zeros_like(x)
print(y, y.shape)
z = np.ones_like(x)
print(z, z.shape)
Matplotlib
Matplotlib이란
- 시각화(Data Visualization) 라이브러리
- 선 그래프(plot), 산점도(scatter plot), 히스토그램(Histogram) 등의 데이터 분석 시각화에 많이 사용되는 MATLAB 형태의 그래프를 그릴 수 있다.
- 선 그래프(plot), 산점도(scatter plot), 히스토그램(Histogram) 등의 데이터 분석 시각화에 많이 사용되는 MATLAB 형태의 그래프를 그릴 수 있다.
matplotlib.pyplot 모듈
- matplotlib.pyplot 모듈은 주로 plt라는 별칭으로 사용한다.
🔍 실습 코드
import numpy as np
import matplotlib.pyplot as plt

x = np.arange(1,10)
y = x**2
plt.plot(x,y)
plt.title('This is title')
plt.xlabel('X-axis')
plt.ylabel('Y-axis')
plt.show()
결과

import numpy as np
import matplotlib.pyplot as plt

x = np.linspace(1,10,100)
y1 = np.sin(x)
y2 = np.sin(x + 0.5)
y3 = np.sin(x+1)

plt.plot(x,y1,'r--')
plt.plot(x,y2,'b.')
plt.plot(x,y3,'g-.')
결과

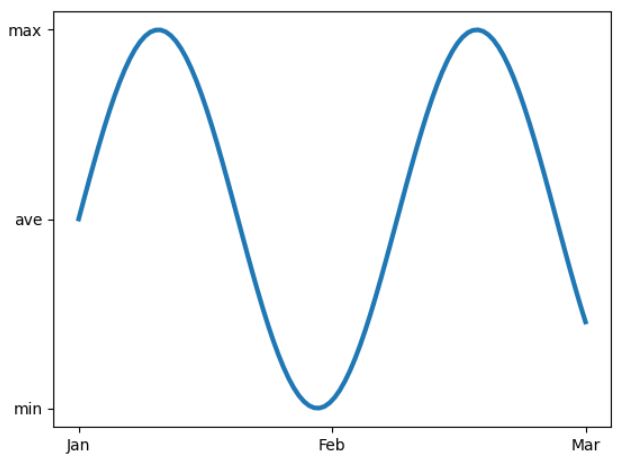
import numpy as np
import matplotlib.pyplot as plt

x = np.linspace(0, 10, 100)
y = np.sin(x)
plt.plot(x, y, linewidth=3)
plt.xticks([0, 5, 10], labels=['Jan', 'Feb', 'Mar'])
plt.yticks([-1, 0, 1], labels=['min', 'ave', 'max'])
plt.show()
결과
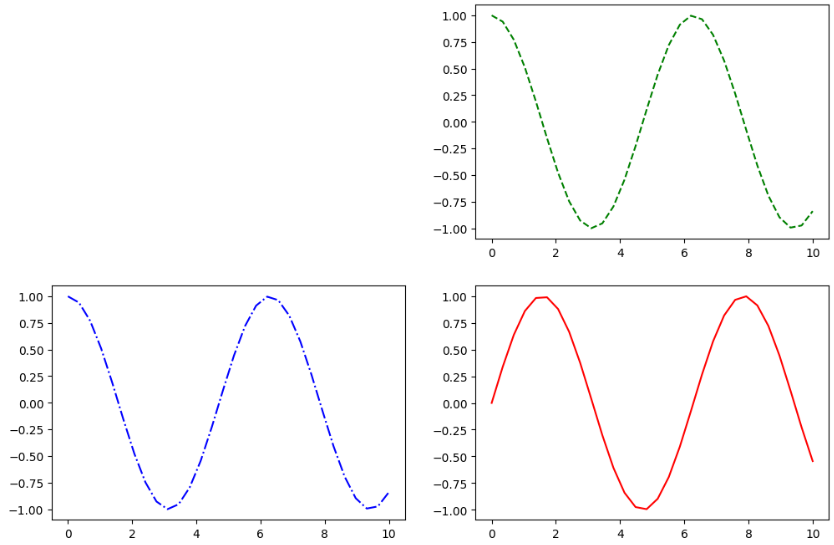
import numpy as np
import matplotlib.pyplot as plt

x = np.linspace(0, 10, 30)
y = np.sin(x)
z = np.cos(x)

plt.figure(figsize=(12, 8))
plt.subplot(2, 2, 4)
plt.plot(x, y, 'r-')

plt.subplot(2, 2, 2)
plt.plot(x, z, 'g--')

plt.subplot(2, 2, 3)
plt.plot(x, z, 'b-.')
plt.show()
결과
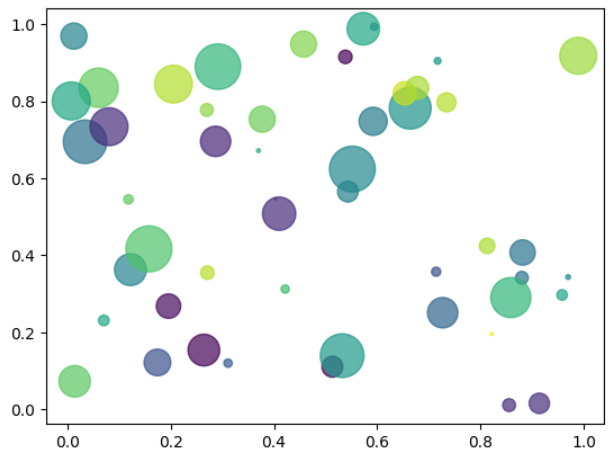
산점도 (Scatter Plot)
import numpy as np
import matplotlib.pyplot as plt

n=50
x = np.random.rand(n)
y = np.random.rand(n)
area = (30 * np.random.rand(n))**2
colors = np.random.rand(n)
plt.scatter(x, y, s=area, c=colors, alpha=0.7)
plt.show()
결과
돌아가기: 2024 하반기 Python Coding Study